An interdisciplinary team of researchers at Carnegie Mellon University (CMU) in Pittsburgh, Pennsylvania have come up with a new, more precise and accurate, way of tracking U.S. greenhouse gas (GHG) emissions. Created by a research team at the university’s Scott Institute for Energy Innovation, the “open source” Power Sector Carbon Index (PSCI) is based entirely on publicly available data.
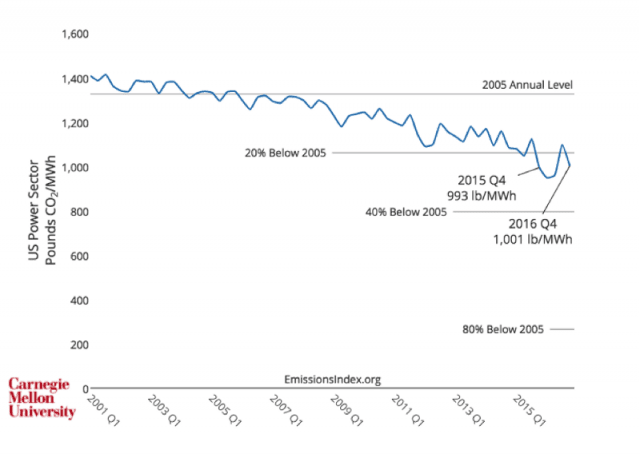
CMU’s PSCI measures carbon emissions intensity – the amount of carbon dioxide (CO2) emissions that result from generation of 1 megawatt-hour (MWh) of electrical energy. According to the latest PSCI data, producing one MWh of electricity in the U.S. in 4Q 2016 resulted in 1,001 pounds (454 kg) of CO2 being pumped into the atmosphere. That’s one percent higher than it was in 4Q 2015.
Despite its declining longer term share of national power generation, an increase in coal power generation drove national power sector emissions higher, with coal power emissions supplanting emissions from natural gas power generation in 4Q. Natural gas power emissions produced the most CO2 of any major fuel power generation fuel source in 2015’s fourth quarter.
A more efficient power sector
Offsetting some of 4Q’s increase, renewable and nuclear energy generation rose as compared to 4Q 2015. For 2016 as a whole, the PCSI came in at 1,005 lb (456 kg) CO2 per MWh, down from 1,325 lb (600 kg) per MWh in 2015.
Among other highlights from the latest PSCI report:
- Coal generation was up by 12 percent in Q4 2016 (305 million MWh) when compared to Q4 2015 (273 million MWh). Coal represented 31.8 percent of total generation in Q4 2016.
– Carbon intensity of coal generation was down by 2 percent in Q4 2016 (2231 lb CO2 per MWh) when compared to Q4 2015 (2281 lb CO2 per MWh).
- Natural gas generation was down by 9 percent in Q4 2016 (294 million MWh) when compared to Q4 2015 (322 million MWh). Natural gas represented 30.6 percent of total generation in Q4 2016. Carbon intensity of natural gas generation was down by 2 percent in Q4 2016 (916 lb CO2 per MWh) when compared to Q4 2015 (930 lb CO2 per MWh).
- Renewable electricity generation was up by 7 percent in Q4 2016 (154 Million MWh) when compared to Q4 2015 (144 million MWh). Renewables represented 16 percent of total generation in Q4 2016.
- Nuclear electricity generation was up by 4 percent in Q4 2016 (198 Million MWh) when compared to Q4 2015 (190 million MWh). Nuclear represented 20.6 percent of total generation in Q4 2016.
Deep emissions cuts needed
Up until now, the U.S. hasn’t had an open, transparent, standardized way of calculating the carbon emissions intensity for the power generation sector. One hurdle has been the process of collecting, checking and verifying the integrity of data sets, which is “cumbersome and time-consuming,” CMU Assistant Professor Costa Samaras and co-author Ines Azevedo wrote in an April 3 Medium blog post.
The PSCI is calculated monthly, quarterly and annually by dividing actual, direct emissions reported by U.S. power sector generation sources in a given time period by the corresponding net amount of electricity generated. 2005 has been serving as a common benchmark when it comes to U.S. climate change, CO2 and greenhouse gas (GHG) reductions policies, so the PSCI also includes a comparison of the percentage changes in current vs. 2005 power sector CO2 emissions intensity.
“Deep emissions reductions are needed in the electricity sector to limit the impacts of climate change,” Samaras highlights. “The Power Sector Carbon Index lets us know how far we’ve come, how we’re doing now, and how far we still have to go.”
Encouragingly, the carbon emissions intensity of U.S. power generation has been trending downward, dropping 24 percent from 2005 through 2016. The shift from coal to natural gas accounted for 53 percent of the improvement, Samaras points out. Growing renewable energy generation accounted for about 40 percent of the decrease since 2005.
*Image credits: Carnegie Mellon University, Scott Institute for Energy Innovation
