Communist or Third World plot to undermine Western economies and civilization, or the most ambitious effort in human history to forge a science-based policy framework to address a critical, increasingly pressing, global problem?
Views differ widely, and debate and controversy persist, but the second installment of the United Nations (U.N.) Fifth Assessment Report (AR5) from the International Panel on Climate Change (IPCC) is clear in its conclusions: Driven by unprecedented greenhouse gas emissions from human sources, the costs and risks associated with rapid climate change are mounting, leaving the poorest and least well-prepared most vulnerable.
Released in Yokohama, Japan, March 31, Climate Change 2014: Impacts, Adaptation and Vulnerability, IPCC Working Group II’s (WG2) contribution to the IPCC’s Fifth Assessment Report is the organization’s clearest statement yet on the growing risks and dangers we are flirting with given the uninterrupted and unprecedented rise in anthropogenic carbon and greenhouse gas emissions.
The IPCC’s Fifth Global Assessment of Climate Change
The second installment of the IPCC’s AR5 brought together thousands of climate scientists from around the world and representatives from the 195 national governments and the E.U. who have ratified the UN Framework Convention on Climate Change (UNFCCC) in a long, arduous, transparent, and open process not only to assess the risks and threats posed by climate change, but to identify and foster adoption of climate change-resistant pathways of sustainable development.
Justifiably reticent to link specific incidences of extreme weather with long-term climate change, 2013’s record weather lends credibility and validity to the climate models IPCC scientists have been using and continue to develop and refine.
Not only did 2013 confirm the global warming trend and the linkage with anthropogenic greenhouse gas emissions—tying with 2007 as the sixth warmest year on record—according to the U.N. World Meteorological Organization (WMO), but there were 43 separate billion-dollar economic loss events. That’s a lot more than the 10-year average of 28, according to Aon Benfield’s Annual Global Climate and Catastrophe Report, 2013.
Following is a video of the IPCC press conference.
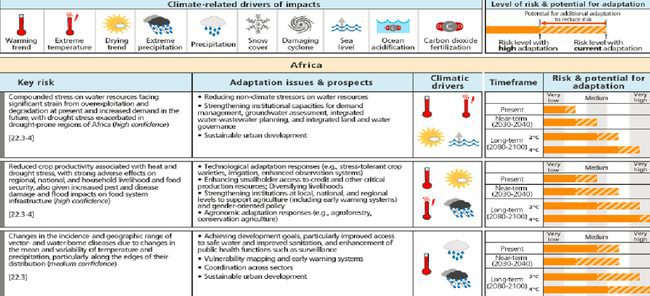
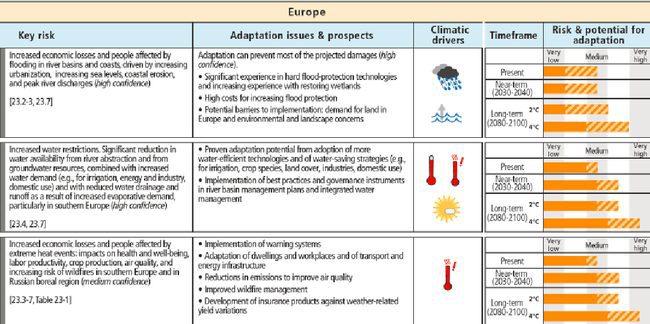
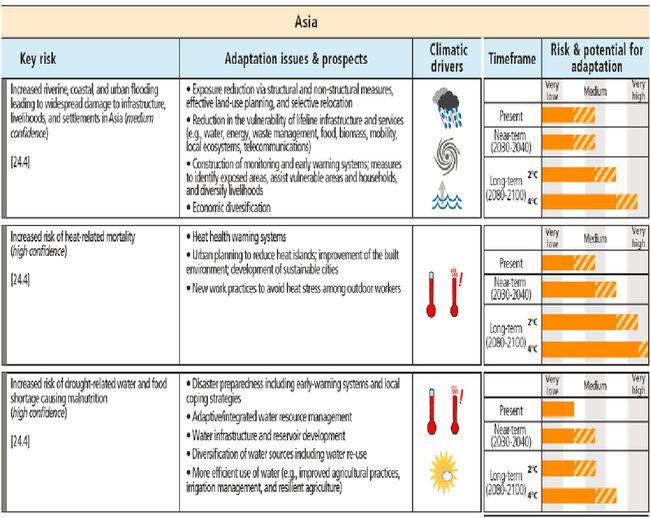
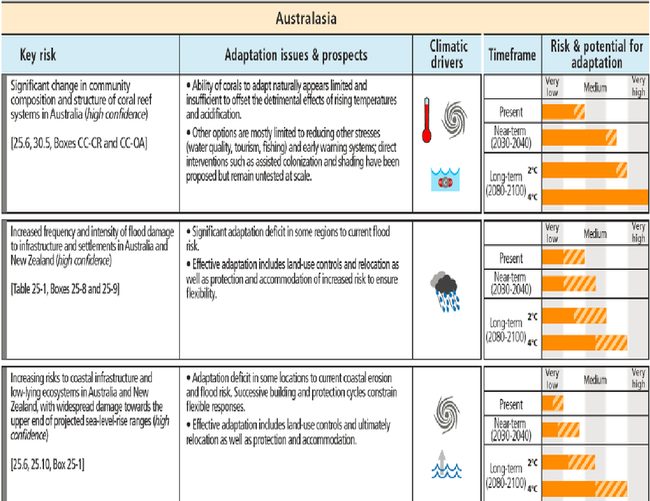
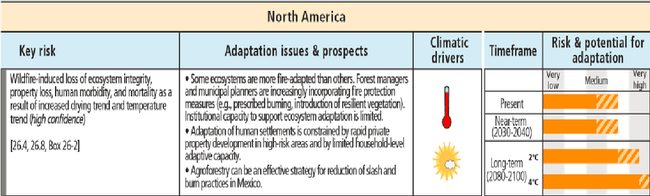
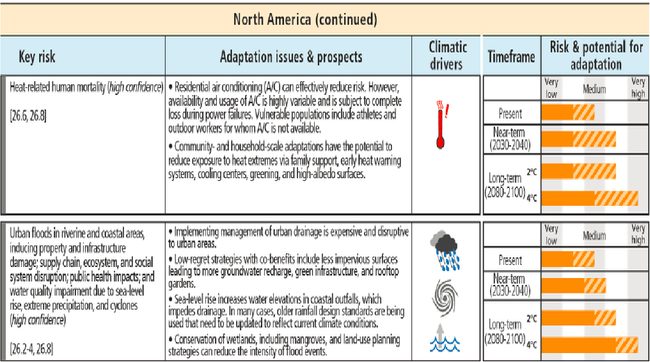
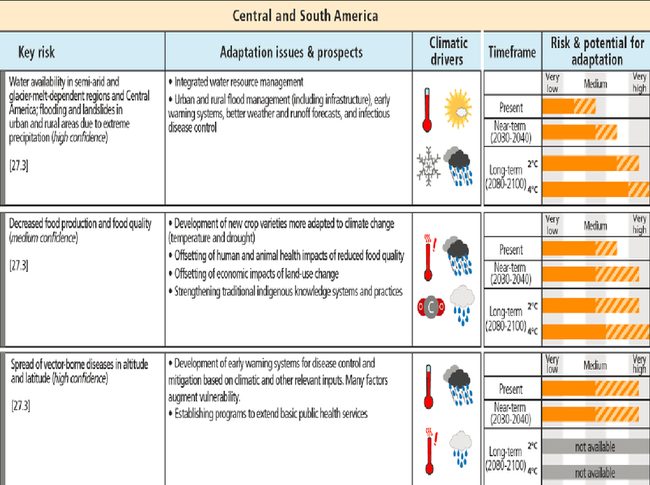
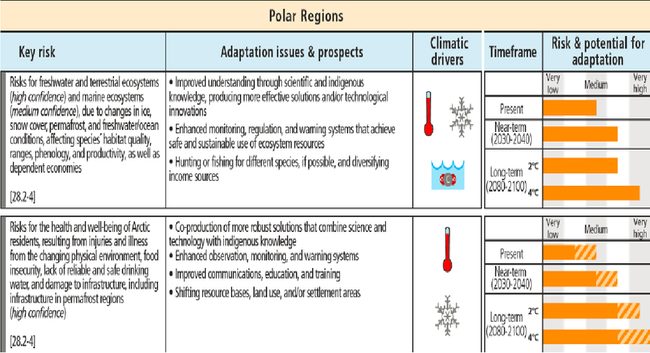
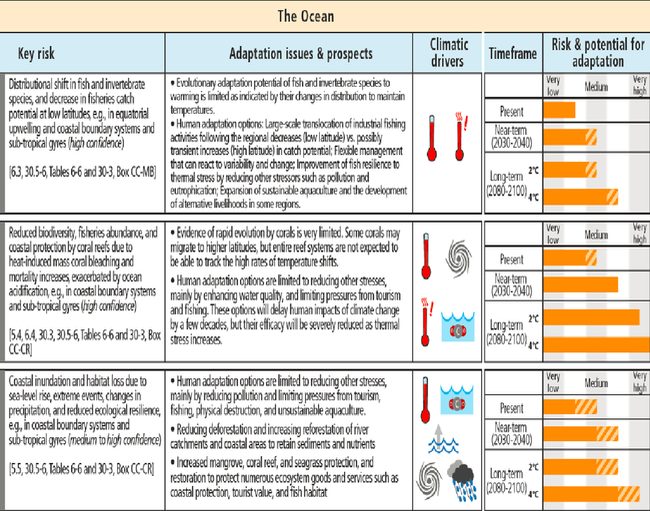
The following tables, contained in AR5 WG2’s “Summary for Policymakers,” summation of the key risks, climatic drivers, adaptation issues and prospects, risk and potential for adaptation, and associated time frames for action.


Earth’s climate is dynamic and always changing through a natural cycle
Dr. S. Jeevananda Reddy
The Earth’s climate is dynamic and always changing through a natural cycle. What we are experiencing now is part of this system. We expect from this pattern, that areas of India that are under southwest monsoon influence will have to bear the burden of frequent droughts after 2016 for a period of three decades.
In this period we expect higher temperatures. The areas with northeast monsoon influence, this period will be six decades. The frequency of occurrence of floods in rivers follows this pattern. This is nothing to do with global warming. We are destroying water resources and agriculture with the new technologies that meet the greed of few MNCs.
In IPCC scenario we are not looking at the evil “pollution” but worried more on anthropogenic greenhouse gases as it is easy way to save MNCs. IPCC is looking at number of people supporting their view point. In science number of people has no meaning. It has to be validated from ground realities. Here the quantity over rides the quality.
The agriculture issues dealt in the present IPCC report are nothing new. They were discussed since early 90s and also outlined by World Bank in its 2013 report. In fact these issues were discussed elaborately in terms of models, risks & adaptations to climate change in my books relating to global issues in 1993, Indian issues in 2002 and practical issues in 2011.
One-third of the production is going as waste and thus the equivalent of natural resources and investments are going as waste. Large share of river flow join seas and oceans. Here politics play the vital role and not the global warming. With the industrialization, the developmental activities moved to coastal zones. This affected severely the coastline that used to protect from weather disasters and thus affecting the livelihood of millions of people.
Pollution is affecting the life in the coastal waters. The major culprit is the air, water, soil & food pollution that needs immediate action plan and not the pseudo global warming. We must not forget the fact that climate change is not the de-facto global warming. They are quite different. When we discuss the issues of climate change, this must be kept in mind.
IPCC versus Global Warming versus Climate Change: Is IPCC using global warming synonymous to climate change? The so-called impacts on nature relate to global warming or climate change? Global warming is a trend in temperature and climate change is a trend and rhythmic variations, in which extremes form part, in temperature and rainfall. During drought years the temperature and evaporation goes up and during flood years the temperature and evaporation goes down.
My studies in early 80s showed that cube root of precipitation follows the global solar radiation and evaporation. Because of this interrelation between rainfall and temperature, the rhythmic variation present opposite patterns. My studies in late 80s showed that Indian southwest monsoon precipitation and thus the global temperature followed a 60-year cycle.
WMO released a press note on extreme weather events of 2013 on the occasion of World Meteorological Day (23-3-2014) in which it observed droughts and warming conditions in Southern Hemisphere Nations. My studies of early 1980s on the rhythmic variations in precipitation data series of stations in Southern Hemisphere Nations and projections showed below the average precipitation during 2013.
Though in the Southern Hemisphere nations presented cycles of different periods in the precipitation data series [52 to 66 years], coincidentally majority of them showed below the average pattern during 2013. The higher temperature regime in Southern Hemisphere Nations could be attributed to the dry weather prevailing in 2013. This is not part of global warming but it is a part of climate change – natural variation. These influence the water resources availability and thus agriculture.
IPCC, states that “Global Warming” is the increase in the average temperature of global surface air and oceans since about 1950, and to continuing increases in those temperatures. In the last 17 years there is no such increase in global temperature. IPCC [AR4 – 2007] states that “confirms that global warming is now unequivocal and states with more than 90% certainty that increasing concentrations of greenhouse gases produced by human activity very likely has been the primary cause of rising temperatures worldwide since 1950”. IPCC [AR5 – 2013] changed 90% and very likely to 95-100% and extremely likely.
It also states that “Human influence has been detected in warming of the atmosphere and the ocean, in changes in the global water cycle, in reductions in snow and ice, in global mean sea level rise, and in changes in some climate extremes.
It is extremely likely that more than half of the observed increase in global average surface temperature from 1951 to 2010 was caused by the anthropogenic increase in greenhouse gas concentrations and other anthropogenic forcings together”.
All this means that around 50% of the trend in global average temperature starting from 1950 is termed as global warming. The rest is not associated with global phenomenon but primarily associated with local and regional changes in association with ecological changes – land use and land cover changes –.
Though they contribute to global temperature in averaging process but their impact is confined to local and regional issues only. Here heat-island effect may be over emphasized in the averaging due to dense network of met stations and less emphasized cold-island effect due to sparse network of met stations. The disparity is growing with growth of population-urbanization and wet-land agriculture — these are associated with changes in land use and land cover. Because of this, the Southern Hemisphere temperature is lower than that of Northern Hemisphere. Because of this the NASA satellite data showed no increasing trend in global average temperature – this was later removed from the internet & I included this in my book.
Very recently British Royal Society and US National Academy of Sciences brought out an overview “Climate change: Evidence & causes”. The report included a figure of annual march of global temperature anomaly along with 10-year, 30-year & 60- year moving average patterns using 1850 to 2010 data series.
WMO presented a manual on “Climate change” in 1966; and in this manual presented moving average technique as one of the technique to separate trend from rhythmic/systematic variations. Here, the 60-year moving average pattern showed the trend after eliminating 60-year rhythmic variation. The trend showed less than 0.5 oC raise during 1950 to 2010. After correcting this figure for overestimation and underestimation factors discussed above, is expected to be less than 0.5 oC. As per AR5 summary, around 50% of this [far less than 0.25 oC] is contributed by anthropogenic greenhouse gases, which is termed as global warming. This is insignificant to impact nature.
Thus, by 2100, global warming component is expected to rise by less than 0.5 degree Celsius!!!
Impact on agriculture & related issues: Deccan Chronicle, a daily News paper from Hyderabad dated 20th June 2013 presented a report “World Bank releases report, paints grim picture of future – Global warming to dry up rivers, inundate cities”. It observed that India’s monsoon will become highly unpredictable if the world’s average temperature rises by 2oC in the next two-three decades.
Below this article presented my observations also. Indian agriculture scientists in the same tone and tenor forecasted using El Nino saying that it is destroying agriculture, production is coming down by around 20%, severe losses to dry-land agriculture, affecting northeast monsoon, etc.
By looking at yield levels versus El Nino intensity [1–weak, 2–medium and 3–strong], there is no correlation; and yet they deduced such strange conclusions. In fact the yield is a function of chemical inputs, which I published more than a decade back. Also, reports after reports were published saying that production is less than the demand and thus price rise and affecting food security.
At the same time FAO report presents that globally 30% of what is produced is going as waste. This is 40-50% in India. That means to that extent the natural resources & finances used are going as waste. In India, the main reasons for such losses are lack of storage facilities, and timely transport facilities.
All these are nothing to do with global warming but it relates to poor governance and business manipulations.
Political effect: In India, though planned to link-rivers to improve the quality of life in rainfed areas, vote bank politics creating more problems under the disguise of interstate disputes on water sharing on one side and World Bank on the other side. Even Prime Minister, the President & the highest court in India is colluding with the ruling junta on this issue.
World Bank and its PR groups are working against building dams in India. Now they say climate change as a culprit.
Unfortunately, climate change is a part of dam development. Rainfall variations were taken in to account while building dams. In the case of Andhra Pradesh UPA [this will be the same with NDA government or any other government] government is playing vote bank political game with Polavaram project under the disguise of state bifurcation. This project should have been completed by this time. In the case of Krishna River water sharing UPA government appointed a tribunal consisting of three judges of their choice to favor Karnataka & Maharashtra at the cost of Andhra Pradesh.
At present Andhra Pradesh is getting allocated water [by the first tribunal] in 75% of the years. The new tribunal as vote bank package through technical fraud, proposed new allocations. Andhra Pradesh will be getting the allocated water in only 25% of the years. These are nothing to do with global warming but it relates to governance – political effect. This will affect the water availability and agriculture.
IPCC’s WG-II AR5: It is the second of three assessment reports that assesses the impacts of climate change, adaptation and vulnerability of human and natural systems, runs around as highlighted by UN climate change secretariat in Bonn “The IPCC report makes clear that people around the world are already suffering from climate change, as it directly affects their livelihoods, reducing crops, destroying homes and raising food prices, and that this will accelerate if climate change is left unchecked – it implies global warming and not climate change –. It provides a detailed assessment of regional aspects, which give a much clearer understanding of climate impacts in different regions.”
Touching the human conflict aspects, the secretariat said, “Among other things, the report warns that climate change increases the risk of armed conflict around the world because it worsens poverty and economic shocks. Therefore, climate change is already becoming a determining factor in the national security policies of states.”
All these hypothetical statements are made with political interests; and have nothing to do climate change. We have seen some of these in the above sections. Let me present important paras from three chapters:
Chapter-3: Fresh water resources — under the executive summary of key risks at the global scale, IPCC observed “So far there are no widespread observations of changes in flood magnitude and frequency due to anthropogenic climate changes but projects imply variations in the frequency of floods (medium agreement, limited evidence). Flood hazards are projected to increase in parts of south, southeast and northeast Asia, tropical Africa, and South America (medium agreement, limited evidence).
Since the mid-20th Century, socio-economic losses from flooding have increased mainly due to greater exposure and vulnerability (high confidence). Global flood risks will increase in the future partly due to climate change (medium agreement, limited evidence. There is little or no observational evidence yet that soil erosion and sediment loads have been altered significantly due to changing climate (medium agreement, limited evidence).
However, increases in heavy rainfall and temperatures are projected to change soil erosion and sediment yields, although the extent of these changes is highly uncertain and depends on rainfall seasonality, and land cover, and soil management practices.
Chapter-7: Food security and production systems — Though crop production relates to the fresh water resources, under executive summary of this chapter, IPCC observed “The effects of climate change on crop production are evident in several regions of the world (high confidence). All aspects of food security are potentially affected by climate change, including food access, utilization, and price stability (high confidence).
Chapter-24: Asia – under executive summary, IPCC observed “Warming trends and increasing temperature extremes have been observed across most of the Asian regions over the past century (high confidence). Increasing numbers of warm days and decreasing numbers of cold days have been observed, with the warming trend continuing into the new millennium. Precipitation trends including extremes are characterized by strong variability, with both increasing and decreasing trends observed in different parts and seasons of Asia.
This is exactly what I was advocating (high confidence) since long wherein the observed changes in nature are mainly associated with physical impacts due to human action and natural variations; and not with the anthropogenic global warming. Also, so far the increase of anthropogenic global warming is insignificant to influence nature and weather systems. We are working in a climate system that showed high seasonal and annual variations. We can see this from Climate Normal books. We need to make better and efficient use of the available resources. We must choose technologies that will not destroy our natural resources. We must look at pollution and not at anthropogenic greenhouse gases.
Concluding remarks: Unfortunately, IPCC and other agencies are attributing all ills of the society to global warming, a phenomenon that is insignificant to influence nature. The issues that are raised under water resources and agriculture by IPCC are nothing to do with global warming but they are primarily related to poor governance and human physical impacts on nature. We must adapt to natural variations in climate. This is what our forefathers did. We need to control pollution [air, water, land & food] and reduce the wastage in food and water resources through better management. We must use local technologies that help in this direction.
References:
Reddy, S. J. (1993) Agroclimatic/Agrometeorological Techniques: As applicable to dry-land agriculture in developing countries.http://www.scribd.com/Google Books, [Book Review appeared in Agric. For. Meteorol., 67:325-327, 1994], 205p.
Reddy, S. J. (2000) Andhra Pradesh Agriculture: Scenario of last four decades. Hyderabad, India, 104p.
Reddy, S. J. (2002) Dry-land agriculture in India: An agroclimatological and agrometeorological perspective. BS Publ. Hyderabad, India, 429p.
Reddy, S. J. (2007) Agriculture & Environment. Hyderabad, India, 112p.
Reddy, S.J. (2008) Climate change: Myths & Realities.http://www.scribd.com/Google books, 176p.
Reddy, S. J. (2011) “Green” Green Revolution: Agriculture in the perspective of climate change. http://www.scribd.com/Google books, 160p.
Gupta, R.K. & Reddy, S. J. (Eds.) (1999) Advanced technologies in meteorology. Tata McGraw-Hill Publ. Comp. Ltd., New Delhi, India, 549p.
WMO (World Meteorological Organization) (1966) Climate change. Tech. Note No. 79, prepared by J. M. Mitchell et al., Genewa, Switzerland.
(Dr. S. Jeevananda Reddy, Formerly Chief Technical Advisor – WMO/UN & Expert – FAO/UN Fellow, Andhra Pradesh Academy of Sciences, Convenor, Forum for a Sustainable Environment)
Note: A UN Report issued on 6th April 2014 from Oslo observed “The September report raised the probability that human actions, led by the use of fossil fuels, are the main cause of climate change since 1950 to at least 95 percent from 90. But opinion polls show voters are unpersuaded, with many believing that natural variations are the main cause. ”
IPCC synthesis Report [AR 5] released on 1/11/2014: Myths & Realities
Dr. S. Jeevananda Reddy
Formerly Chief Technical Advisor – WMO/UN & Expert – FAO/UN
Fellow, Andhra Pradesh Akademy of Sciences
Convenor, Forum for a Sustainable Environment
Hyderabad, India
Tel. (040)23550480; Email:Jeevananda_reddy@yahoo.com
The following are few headlines taken from the IPCC’s Summary Synthesis Report:
1. Observed changes and their causes: Human influence on the climate system is clear, and recent anthropogenic emissions of greenhouse gases are the highest in history. Recent climate changes have had widespread impacts on human and natural system.
1.1 Observed changes in the climate system: Warming of the climate system is unequivocal, and since 1950s, many of the observed changes are unprecedented over decades to millennia. The atmosphere and ocean have warmed, the amounts of snow and ice have diminished, and sea level has risen.
1.2 Causes of climate change: Anthropogenic greenhouse gas emissions have increased since the pre-industrial era, driven largely by economic and population growth, and are now higher than ever. This has led to atmospheric concentrations of carbon dioxide, methane and nitrous oxide that are unprecedented in at least the last 800,000 years. Their effects, together with those of other anthropogenic drivers, have been detected throughout the climate system and are extremely likely to have been the dominant cause of the observed warming since the mid-20th century.
1.3 Impacts of climate change: In recent decades, changes in climate have caused impacts on natural and human systems on all continents and across the oceans. Impacts are due to observed climate change, irrespective of its cause, indicating the sensitivity of natural and human systems to changing climate.
Evidence of observed climate – change impacts is strongest and most comprehensive for natural systems. In many regions, changing precipitation or melting snow and ice are altering hydrological systems, affecting water resources in terms of quantity and quality (medium confidence). Many terrestrial, freshwater, and marine species have shifted their geographic ranges, seasonal activities, migration patterns, abundances, and species interactions in response to ongoing climate change (high confidence). Some impacts on human systems have also been attributed to climate change, with a major or minor contribution of climate change distinguishable from other influences. Assessment of many studies covering a wide range of regions and crops shows that negative impacts of climate change on crop yields have been more common than positive impacts (high confidence). Some impacts of ocean acidification on marine organisms have been attributed to human influence (medium confidence).
1.4 Extreme events: Changes in many extreme weather and climate events have been observed since 1950. Some of these changes have been linked to human influences, including a decrease in cold temperature extremes, and an increase in warm temperature extremes, an increase in extreme high sea levels and an increase in the number of heavy precipitation events in a number of regions.
My Observations
IPCC switched from prediction to projection. The report observed “recent anthropogenic emissions of greenhouse gases are the highest in history” but in global temperature there is a hiatus, plateau, pause or whatever you want to call it for the last 17 years. And yet without taking this in to account IPCC says “warming of climate system is unequivocal”. IPCC now brought in new word “Climate System”. They did not dealt, what they mean by climate system. Whether this includes natural inbuilt variations along with the ecological changes; regional general circulation patterns; and extra-terrestrial impacts, etc or it refers to only global warming?
From the above it is clear that IPCC was choosy in using the words – most of them are ambiguous like human influence. Nowhere, they referred the word “global warming”. Also, it is not clear whether the word “climate change” is referred as de-facto global warming. They were very tactful this time. They did not use the word around half the global temperature raise as global warming and instead used qualitative words like “dominant”. The other qualitative word is “recent”.
In 1.4 IPCC states “number of regions”, which means the impact is not uniform to globe. The impact is observed at some zones only. By reading the two sentences under “1 – Observed changes and their causes” one wonders what IPCC wants to tell the world. Here IPCC uses “widespread”. These have no meaning except to confuse and interpret as it suits their ideology. Generally we use this word in weather forecasting referring to a particular region.
The measurements of greenhouse gases started in around 1956 then where from the word “in history” come. When we use a truncated part of rhythmic series “recent” give false alarm lead to misleading conclusions based on the part of rhythmic variation the selected data represents.
Most of the projections are highly hypothetical and not based on facts. IPCC states “it is based on the author teams’ evaluations of underlying scientific understanding and is expressed as a qualitative level of confidence (from very low to very high) and, when possible, probabilistically with a quantified likelihood (from exceptionally to virtually certain), where appropriate, findings are also formulated as statements of fact without using uncertainty qualifiers.” That means they used different qualifiers as per convenience. In science, it should be of uniform in nature.
The following are some of my observations on the implications of climate change specifically for India.
Effects of Climate Change on Weather:
The largest chunk of the IPCC synthesis report focuses on the changes in weather patterns and projections related to extreme weather events. It pronounces that these changes are expected to have cascading effects on the health of the economy as well that of the people.
The report observed that the number of monsoon break days is expected to increase while the number of monsoon depressions will see a decline; and at the same time it observed that “mean and extreme precipitation during the Indian summer monsoon is expected to increase”. This cannot be true as with the decrease of depressions rainfall & extreme rainfall decreases as the Indian monsoon precipitation is primarily linked to low pressure systems.
Indian monsoon systems are related to general circulation patterns in different seasons coupled with natural rhythm in meteorological parameters. This we can see from the thumb rules. One such thumb rule is: when low pressure system is located in the Kolkata [Calcutta] region then Hyderabad region will be dry [no precipitation] in southwest monsoon season. This is true even today. Also the onset of monsoon over Kerala Coast follows the pattern of 52 year cycle. The All India southwest monsoon precipitation follows the 60-year cycle. With this, from 2017 to 2046 the precipitation will be below the average part of 60-year cycle. In this period expected more drought years and less flood years and thus frequency of occurrence of floods in NW Indian rivers will be few; and consequently the temperature will be higher and thus evaporation. This will affect the dry-land agriculture in many years.
Extreme weather events: cyclones, floods and droughts
The IPCC report observed that the frequency of cyclones likely decrease in 2030s. Floods and droughts are likely to increase in India since there will be a decline in seasonal precipitation, coupled with extreme precipitation during monsoon.
Cyclonic activity
During 1891 to 1990 cyclonic disturbances in Arabian Sea are 259 [143 depressions, 47 cyclonic storms & 68 severe cyclonic storms] and in Bay of Bengal they are 1212 [767 depressions, 260 cyclonic storms & 185 severe cyclonic storms]. Majority of cyclonic storms and severe cyclonic storms are seen in pre-monsoon and post monsoon seasons. In the pre-monsoon season the temperature reaches to maximum peak and during post-monsoon season the temperature comes under declining phase to reach minimum in a sinusoidal curve. The data presented by Joint Typhoon Warning Centre on clones per year during 1945 to 2000 showed a 56 year cycle. This follows the northeast monsoon precipitation pattern of Andhra Pradesh State in India. During 1945 to 1972 the frequency was above the average and from 1973 to 2000 the frequency was below the average. From 2001 to 2056 will repeat 1945 to 2001 pattern. That means 2029 to 1956 follow the frequency of below the average. The average no. of cyclones per year are 10; during the below the average part they are 2 to 8 and during the above the average part are 10 to 16 [except in two years with 4 & 8].
In 1977 severe cyclone around 10,000 people died, in 1990 cyclone only around 1000 people died; though the later one is more severe than the 1977 cyclone. The death toll was higher in 1977 as the area is low lying – below sea level. In the 2014 severe cyclone the loss of human life was around 3 to 5 persons but latter addition was around 50. So the impact relates to terrain conditions, seawall protection [natural mangroves, etc], destruction of the coast line due to illegal developmental activities and disaster management actions. The cyclonic tracks covered the entire east coast line of Andhra Pradesh, with more frequent around Srikakulam, East Godavari, Krishna, and Nellore districts. Though it was made possible to bring down human losses with better disaster management, the same was not achieved in animal, crop, property losses. This is part of natural rhythm and nothing to do with global warming. Let me present the precipitation variations in three meteorological sub-divisions:
Met Sub-division parameter SWM NEM
Coastal Andhra Mean*, mm 507 (52) 375 (39)
C.V., % 22.2 38.8
Lowest 309 088
Highest 780 703
Rayalaseema Mean, mm 422 (60) 204 (29)
C.V., % 28.8 41.9
Lowest 192 012
Highest 791 455
Telangana Mean, mm 722 (80) 107 (12)
C.V., % 23.5 60.3
Lowest 371 002
Highest 1186 310
* the values in brackets are % of annual mean; SWM = southwest monsoon;
NEM = northeast monsoon; C. V. = coefficient of variation — Estimates
based on 1871 to 1994 data published by IITM, Pune, India
Period part of cycle 28-year average precipitation, mm
SWM NEM
CA R T CA R T
1889-16 Above average 509 432 743 330 188 091
1917-44 Below average 477 386 673 410 205 104
1945-72 Above average 532 423 761 356 198 108
CA = Coastal Andhra, R = Rayalaseema, T = Telangana
28 year averages represent below the average and above the average
periods of 56 year cycle – the cycles of SWM and NEM follow opposite patterns
.
IPCC report states that the India’s temperature will increase from 1.7 to 2.2 oC over 1970 level in 2030. But, the global average temperature has not shown any increase for the last 17 years [1998 to 2014] – in this report IPCC used term like in 2030 instead by 2030!!!
The actual data shows the raise in minimum temperature is higher than that in maximum temperature and yet the value of 2011 is less than 1970 in the case of minimum temperature; the same in the case of maximum temperature shows a small raise from 1970 to 2011. After correcting to 60-year cycle component the trend is very little. The global temperature 60-year cycle varied between -0.3 to +0.3 oC. In such a scenario, can we expect that much rise in Indian temperature?
The temperature is highly variable from season to season; year to year; soil to soil; coast to inland to hilly terrain; etc. The temperature follows the opposite pattern with floods and droughts. Also, crop development is influenced not only by temperature but also by the soil moisture, relative humidity, soil temperature, soil fertility, plant density, fertilizer use efficiency, etc.
The raise in minimum temperature is more in association with the urban heat-island effect. Also, the met network is more concentrated in urban areas. Thus it is over emphasized in the averaging of temperature. The met network is sparsely distributed in rural areas and thus it is underemphasized in the averaging of temperature. The net result results in less than the observed average temperature. The crops are mainly located in rural areas and thus the temperatures in these zones are below the average.
Cold waves and heat waves
In the case of India the heat and cold waves are associated with western disturbances from northwestern region. Their movement to south and east are related to general circulation patterns in the south and east. The extreme temperatures [maximum or minimum] have not exceeded the extremes presented in the 1931-60 normal book [IMD – Red Book]. Temperature presents opposite pattern to precipitation pattern. That is during wet period the temperature comes down over the average and during the dry period the temperature goes up over the average. The cyclic part of the temperature is part of observed temperature. When local terrain, forests are destroyed we get changes in meteorological parameters including temperature.
Effects of climate change on Agriculture:
The IPCC report observed that “Climate change will especially affect the livelihoods of people, agriculture the mainstay of the Indian economy, will see dramatic changes in yields, affecting people’s right to food security.
The two natural resources that are vital for agriculture are the soil and the climate. Man has no control as yet on the climate and needs to adapt to it. The farmer is aware that crop production is limited by climate. He also knows that some crops do well in his region whereas others do not. In tropical regions like India, the production is limited by moisture while in extra-tropical regions it is limited by energy. When a model developed under extra-tropical conditions [SORGF of Texas A & M] tried to apply to semi-arid tropical conditions and found it fails, with poor correlation coefficients both in terms of production of biomass and grain yields. This is even after modifying several sub-models relating to energy factor. When the moisture sub-model was replaced with moisture model developed for the tropical semi-arid conditions the correlation coefficient gone up from 0.35 & 0.37 to 0.85 & 0.81 for biomass and grain yield. Crop development is related to several factors like temperature, photo-period, relative humidity, soil moisture, soil fertility, crop population, etc. Each crop and variety has a range of temperature, where its development needs are met. As a result temperature is not an important factor in India. The main factors for crop production are precipitation/irrigation and fertilizer. Under irrigated agriculture, yield is a function of several factors including soil type, fertilizer, water [quality & quantity], water logging/salinity factors, etc.
Health:
Pollution-induced changes in air and water quality, as well as changes in weather pattern, are expected to have wide-reaching effects on the health of Indians, according to the IPCC report.
To avoid the criticism on the impact of global warming on health, they mixed this with pollution. In fact we are fighting the IPCC and UN on this issue for the long. Don’t mix the pollution with global warming when we are talking of health hazards on life farms. It is entirely different issue and not related to global warming.
Concluding Remarks
The presentations in Synthesis Report of AR5 are quite different from the previous two reports of AR5. This report is filled with ambiguous statements. To avoid the confusion particularly in relation to the impact aspects instead of using the generalized word climate change, use the specific part of climate change, namely global warming, ecological changes, natural variability, etc. This gives the clarity to public on the issue of global warming.
Separate the global warming component from ecological change component. Tell the public, is global warming component since 1951 to date is 0.1 oC or between 0.1 and 0.2 oC? Then only we get the real picture on what will be the global warming by 2100! At present lump sum is used as global warming. The ecological changes part impacts at local and regional scales and not at global scale. As the surface data present an over estimate of ecological change component, use the satellite data for the purpose of separating global warming component from ecological change component.
In the case of sea level change, separate the impact due to global warming from natural variation, land sinking from oil, gas & water extraction, destruction of coast line – particularly protective walls of nature, etc components.
In the case of changes in ice, separate the impact of global warming from the impacts of natural disasters such as earthquakes, volcanoes, nuclear tests, and sporting, etc components.
There is no impact of global warming on Indian weather systems, water resources availability and agriculture production. This is even up to 2100. Natural variability impacts are depicted as caused by global warming only. Extreme weather events are part of natural variability.
IPCC at last recognized the importance of pollution in health. It is also an important factor even for agriculture production.
IPCC must not use ambiguous terminology and present where the data is quantitatively validated.
Dr. S. Jeevanda Reddy